

Built different: how Compare Players turns "I think" into "here's why"
Open the side-by-side and the question stops being whose name you've heard more. Two outfielders, same handedness, both under 40% owned. Without the tool you're picking on vibes. With it, you're answering a five-part question — which lens are you scoring this through?
TL;DRSkim
Luke Raley and JJ Bleday split four ways. Raley wins the last fortnight. Bleday wins the season ledger. Raley wins quality of contact. Bleday wins the projection. The Compare Players page surfaces that disagreement in six seconds and tells you why in the next thirty.
The problem this solves
Every fantasy manager hits the same wall on the wire: two players who are almost the same, where the gut-take coin-flip costs you a starter slot for a week. The "compare" feature on most sites stacks two stat tables next to each other and calls it a day. You end up comparing identical .270 averages and walking away no smarter.
Compare Players is built for the part that matters — the disagreements. When the L14 hot bat is a different player than the season leader, who do you trust? When the Statcast says one thing and the projection says another, which lens applies to your roster need? The page answers that explicitly, lens by lens.
How the page is built
Six sections, each answering one question.
1. The Recommendation header
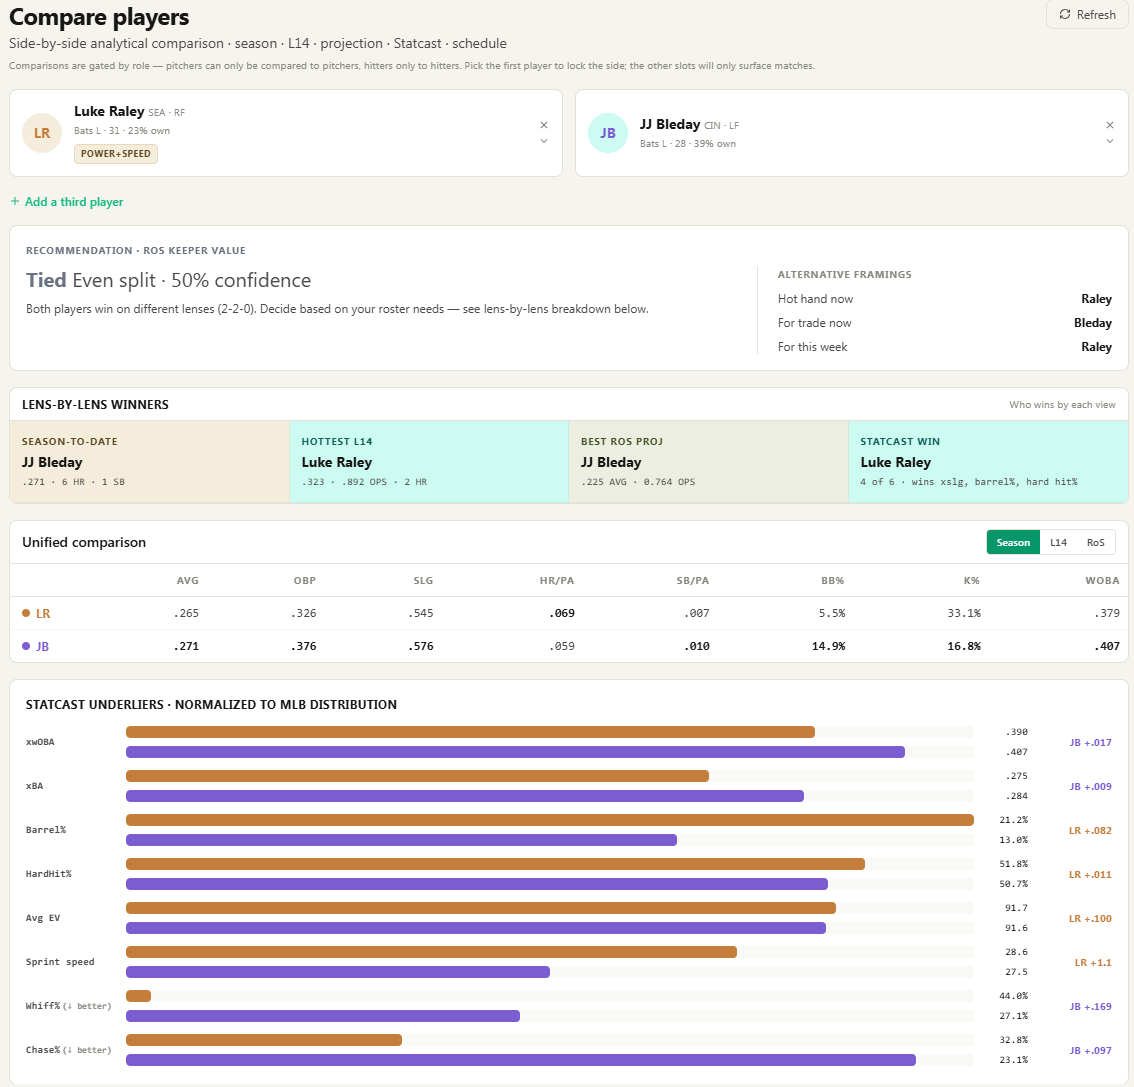
"Tied · Even split · 50% confidence — both players win on different lenses (2-2-0)."
The honest version. When the four lenses don't agree, the tool refuses to bury that with a confident-sounding pick. Instead, the Alternative Framings rail to the right surfaces the actual answer for each likely fantasy context:
- Hot hand now → Raley
- For trade now → Bleday
- For this week → Raley
Streaming this week? Take the hot hand. Pitching a trade where the other manager remembers Bleday's spring? Sell that name. The tool maps the framing to the player; you pick the framing that matches your roster need.
2. Lens-by-Lens Winners
Four cards in a row. Each holds one timeframe and crowns its winner with a one-line stat.
- Season-to-Date → JJ Bleday. .271, 6 HR, 1 SB.
- Hottest L14 → Luke Raley. .323 with a .892 OPS and 2 HR.
- Best RoS Projection → JJ Bleday. .225 / .764.
- Statcast Win → Luke Raley. 4 of 6 categories, including xSLG, barrel%, hard hit%.
This is the screen that tells you the choice is not obvious. If all four cards pointed the same direction, you'd close the tab and add the player. Here, every card is a different name. The disagreement is the signal.
3. Unified Comparison table
A toggle for Season / L14 / RoS sitting over a single table. Same eight columns — AVG, OBP, SLG, HR/PA, SB/PA, BB%, K%, wOBA — same row layout, same color coding. The toggle is the point: instead of three separate tables on three separate tabs, the rows shift in place so the eye stays where it was.
For Raley and Bleday on the Season view, one disconnect leaps out:
| BB% | K% | |
|---|---|---|
| Raley | 5.5% | 33.1% |
| Bleday | 14.9% | 16.8% |
Bleday is the disciplined hitter, Raley is the violent contact. Same OPS, two completely different paths to it.
4. Statcast Underliers — Normalized to MLB Distribution
This is the lie-detector. Each row is one Statcast metric with both players' bars drawn against the MLB distribution; the right margin shows raw values + the delta.
Statcast — Raley vs Bleday (MLB percentile)Raley · Barrel%92Bleday · Barrel%58Raley · HardHit%81Bleday · HardHit%79Raley · Avg EV88Bleday · Avg EV87Raley · Whiff%12Bleday · Whiff%73Raley · Chase%24Bleday · Chase%68Percentile vs MLB average · 100 = elite · 50 = average
What the bars tell you, grouped:
- Contact authority → Raley wins. Barrel% 21.2 vs 13.0 (LR +.082). Avg EV 91.7 vs 91.6. HardHit% 51.8 vs 50.7. When Raley squares one up, he punishes it harder.
- Plate discipline → Bleday wins. Whiff% 44.0 vs 27.1 (JB +.169). Chase% 32.8 vs 23.1 (JB +.097). Raley swings through pitches Bleday doesn't even chase.
- Expected outcomes → Bleday by a hair. xwOBA .407 vs .390 (JB +.017). xBA .284 vs .275. Bleday's discipline pulls his expected stats up because he gives away fewer outs.
This section resolves arguments. "He's been so hot" is one thing — but is the contact quality holding up? Pull this section and you get the answer: with Raley, the contact quality is real (barrel% in the elite tier). With Bleday, the discipline is real (top-quartile plate command). Both have something the other doesn't.
5. Rolling wOBA · Trend chart
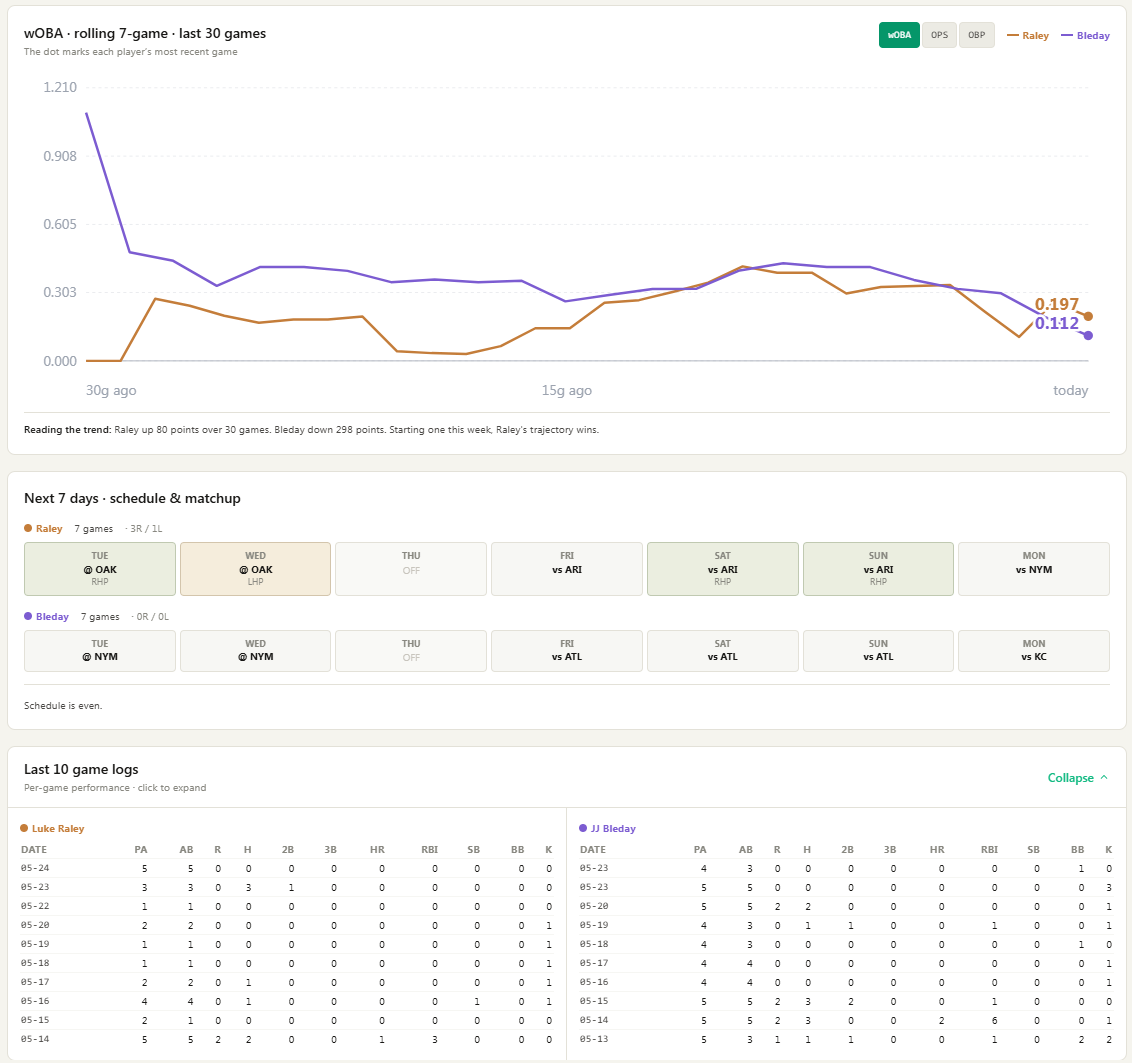
A 7-game rolling line chart over the last 30 games with toggles for wOBA / OPS / OBP. Each line ends with its current value annotated; the dot marks the most recent game.
For Raley vs Bleday, the chart shows the inversion the headline tally misses:
- Bleday started the window above 1.000 wOBA and has been declining steadily. Down 298 points over 30 games.
- Raley started under 0.100 and has been climbing. Up 80 points.
- Most recent: Raley 0.197, Bleday 0.112.
The caption underneath reads "Starting one this week, Raley's trajectory wins." The tool isn't just plotting the slope — it's telling you what the slope means for the next start. You don't have to interpret it. The page does.
6. Next 7 Days · Schedule & Matchup
Seven dated chips for each player, color-shaded by opposing-starter handedness, with platoon-advantage matchups called out.
- Raley: 7 games · 3R / 1L. Lefty bat facing 3 RHPs and 1 LHP — the WED @ OAK chip is shaded because that's his only platoon-disadvantage day. The other six are green-lit.
- Bleday: 7 games · 0R / 0L. "Schedule is even" — no platoon edges either way.
A bat-handedness mismatch shows up immediately. A teaser matchup against a soft-tossing pitcher (the FA-magnet game everyone wants to stream into) flags here. So does a slate full of Cy-Young-grade arms.
7. Last 10 Game Logs
Side-by-side per-game tables with PA / AB / R / H / 2B / 3B / HR / RBI / SB / BB / K. The verification layer — when you read "Raley is hot," scroll down and confirm the box-score arc yourself.
For Raley you see the recent climb: a 3-hit game on 5-23, doubles + triples mixing back in. For Bleday you see the recent quiet: zeros across the last week, with the production cluster sitting two weeks back. The trend chart told you the story, the game logs verify it.
How to actually use this on your roster
The Compare Players workflow runs in three steps.
Step 1 — Pick the lens that matches your decision
- Streamer slot this week → look at L14 + Trend + Schedule.
- Long-term keeper or trade target → look at Season + RoS Projection + Statcast.
- Trade pitch you're sending out → look at the headline stat the other manager will see (.271 season AVG, banked HRs, recent box scores).
The same player can be the right add under one lens and the wrong add under another. Knowing which lens you're scoring through is half the decision.
Step 2 — Find the disagreements
If all four Lens-by-Lens cards point the same direction, the choice is easy and you didn't need the page. When they split — like this Raley/Bleday example — each split is a clue:
- Player who wins L14 + Statcast → your streamer / FAAB target.
- Player who wins Season + RoS → your long-term hold / keeper.
- Player who wins Headline + RoS → your sell-high to a casual league-mate.
Step 3 — Read the Statcast Underliers for the lie detector
Recent hot streak with garbage barrel% and elite whiff% = fluke. Drop or sell before the regression. Recent cold streak with elite barrel%, elite hard-hit%, suppressed BABIP = buy-low. The hot/cold cycles you see in box scores tell you what's happening; the Statcast underliers tell you whether it should continue.
The Raley vs Bleday verdictSkim
Put it all together for this comparison:
- Need a left-handed bench bat for this week's slate? Take Raley. The L14 + trend + the lefty matchup on Wednesday all line up. Trajectory wins.
- Chasing a long-haul OF3 / keeper-league hold? Take Bleday. The discipline edge is structural, the season ledger has banked wins, and his cold spell is closer to ending than Raley's hot spell is to lasting.
- Trying to deal one for a pitcher upgrade? Send Bleday. The .271 / 6 HR / strong xwOBA reads bigger in a trade-block screenshot than Raley's .265 with the loud whiff rate.
Same two players. Three different right answers, depending on the lens.
Try it
Compare Players is live at kodoanalytics.com/players/compare. Drop any two hitters or any two pitchers in — the page gates by role so you never end up comparing apples to ERAs — and the full breakdown builds in under a second.
Five lenses. One screen. One decision.