

Read the room: the Player Profile page is the only one you need open during the season
https://kodoanalytics.com/players
A great player page isn't a stat dump. It's a decision tree. Open Bo Bichette's profile and the question stops being "is he good?" and becomes "good for what — this week, this season, or this keeper league?" Seven tabs, each tuned to a different fantasy question. Here's how to read it.
TL;DRSkim
Bichette's profile across seven tabs answers seven different questions:
- Overview — should I add him today?
- Trends — is he heating up or breaking down?
- Career & Projections — should I keep him?
- Splits — should I start him tonight?
- Game log — what's the box-score truth behind the trend?
- News — what just changed?
- Depth chart — is the playing time stable?
Same player. Seven different lenses. The hero card on top stays constant — name / status chips / Last 7 starts dot strip / Watch + Compare buttons — so the meta-context never disappears as you switch views.
Tab 1 — Overview
The TL;DR tab. You open this when someone drops a name in your league chat and you need a 10-second take.
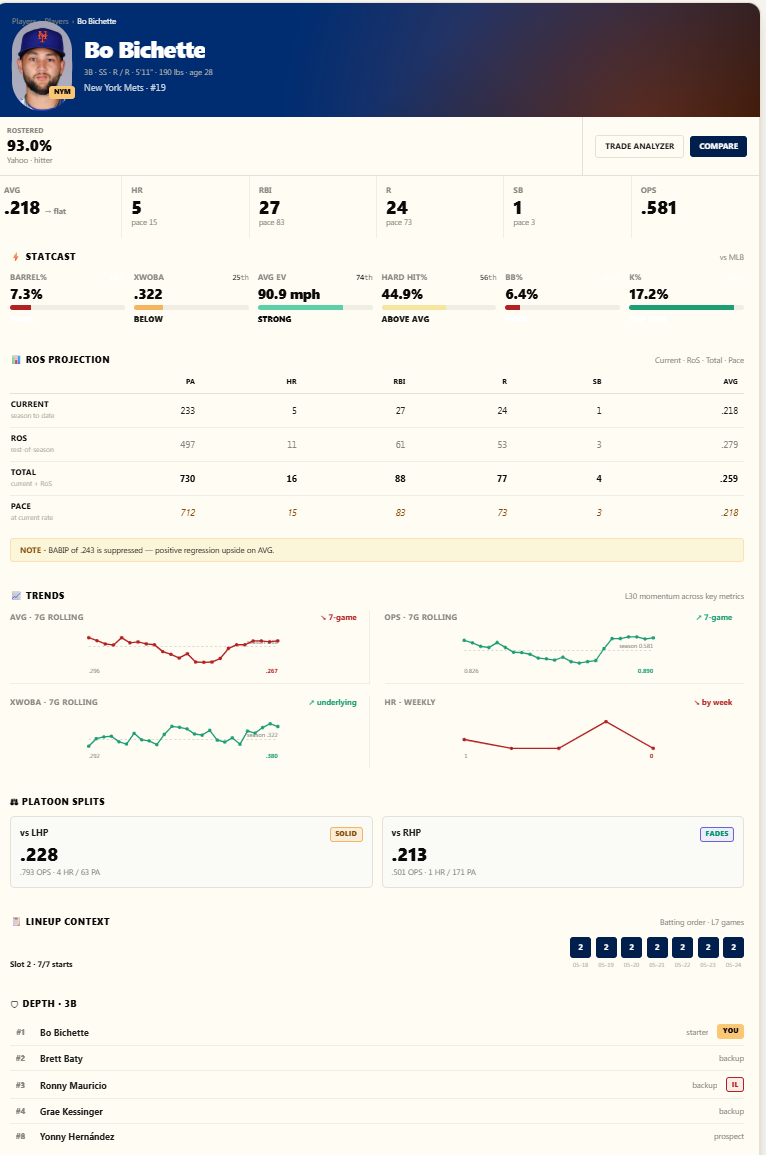
The rostered % strip
The opening number — 93.0% rostered — frames the rest of the page. Anything above 90% is widely held; that means you're not finding edge here, you're evaluating a holds-and-trades question, not a wire add. Below 30% is your add territory. Between 30 and 70 is platoon / streamer land.
The stat row + Statcast underliers strip
Six counting cells (AVG / HR / RBI / R / SB / OPS) followed by the seven-bar Statcast strip with percentile labels. The label under each bar gives the verdict in one word — BELOW, STRONG, ABOVE AVG. For Bichette: Avg EV 90.9 mph is STRONG, Hard Hit% 44.9% is ABOVE AVG, but Barrel% 7.3% is BELOW and K% 17.2% is suppressed. Translation: he's making consistent contact, just not the elite-quality kind that drives BABIP back up.
Bichette · current-season Statcast percentiles vs MLBBarrel%17xwOBA51Avg EV78HardHit%71BB%22K%88Percentile vs MLB average · 100 = elite · 50 = average
The ROS Projection table
Four rows in this order: CURRENT (what he's done), ROS (what he'll do), TOTAL (sum of the two), PACE (current scaled to 162 games).
The table answers two questions at once: what's the final line going to be? and is he running below or above his pace? When the PACE row reads higher than the PROJECTION row, the model is calling for regression. The NOTE: callout below ("BABIP at .243 is suppressed — positive regression upside on AVG") is the page's diagnostic — it tells you why the projection won't simply extrapolate the current pace.
The trends mini-charts
Four sparklines in a row (AVG / OPS / xwOBA / HR weekly) showing the last 7 games + a trend tag. Each chart has its own emoji-grade verdict baked in — 7-game, underlying, by week — so you don't have to interpret the slope, the page does.
Platoon splits + lineup + depth
Two chips for platoon (vs LHP .228 badged SOLID; vs RHP .213 badged FADED). Below them, batting-order history over the last 17 games, and the four players queued behind Bichette at 3B with starter / backup / prospect tags. The Overview tab packages "should I add him?" into one screen.
Tab 2 — Trends
Open this when the question is "is the recent stretch a real change or noise?"
Monthly 5×5 Rank
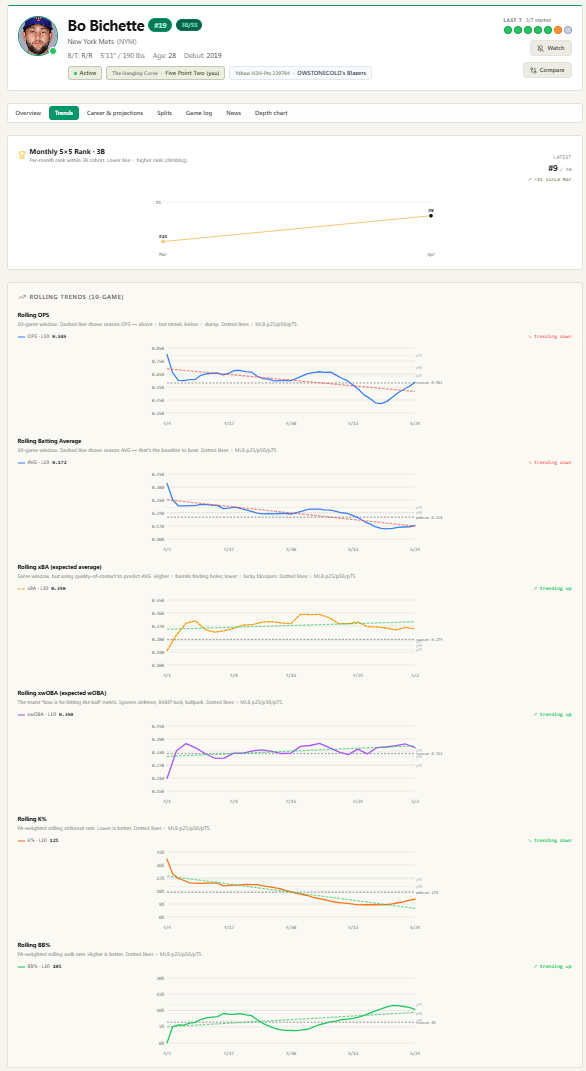
A simple line chart of the player's rank within his position over the last 5 months. Bichette: was #26 in March, now #9 in April. The caption frames it: "#9 → ↑ 17 since Mar." That's a 17-spot positional climb in a month. Big move.
Rolling Trends — 10-game
Six panels, each a 10-game rolling line with:
- The player's rolling value (solid line).
- The player's season baseline (the goal: above means improving, below means deteriorating).
- Dotted lines at MLB p25 / p50 / p75 so you can see where the player sits in the distribution.
- A
trending uportrending downtag in the top-right corner.
The six metrics, in order: OPS, Batting Average, xBA (expected — quality-of-contact baseline), xwOBA (the trust-it-the-most underlying), K% (lower is better), BB% (higher is better).
For Bichette in May: OPS trending down to 0.491, AVG trending down to 0.172, but xBA trending up to 0.250 and xwOBA trending up to 0.298. The reading: surface-level numbers are bad, underlying quality is recovering. Which means the bad surface numbers are about to flip.
This pattern is the most important read on the entire profile page. When the rolling AVG breaks down but rolling xBA breaks up, you are looking at a buy-low window. Most managers see the .172 and panic-drop. The xBA panel tells you they're wrong.
Tab 3 — Career & Projections
Open this when the question is "should I keep him next year?" or "is the current slump structural?"
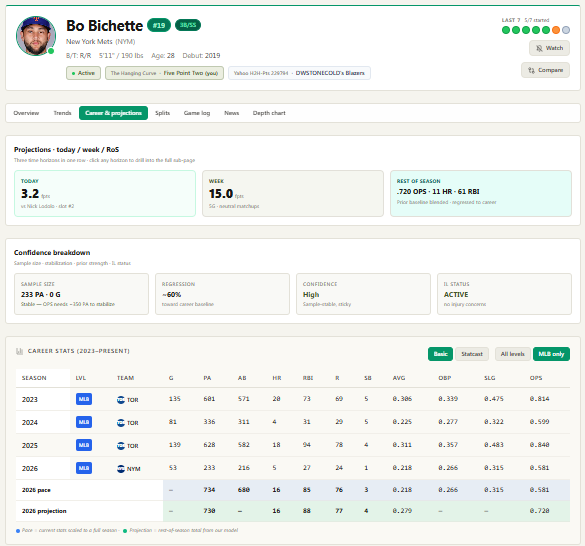
Three projection horizons in one row
- TODAY —
3.2 fpts, with context (e.g. vs Nick Lodolo · slot #2). This is the streamer answer. - WEEK —
15.0 fpts, with the matchup arc note (5G · neutral matchups). The week-of-the-FAAB answer. - REST OF SEASON —
.720 OPS / 11 HR / 61 RBI. The keeper-league answer.
Confidence breakdown
Four cells — every projection page should have these and most don't:
- Sample Size —
233 PA · 0 G stable + OPS needs ~150 PA to stabilize. The fast-talk version of empirical-Bayes weighting. - Regression —
~60% toward career baseline. How much the model is anchoring to his multi-year mean vs his current line. - Confidence —
High · sample-stable, sticky. Plain-English summary. - IL status —
Active · no injury concerns.
Without these four cells, a projection is just a number. With them, it's a number you can argue with.
Career stats — Basic view
Season by season (G / PA / AB / HR / RBI / R / SB / AVG / OBP / SLG / OPS). Two bonus rows at the bottom: 2026 pace (current scaled out) and 2026 projection (model's forecast). The gap between those two rows is the page's regression call in raw stats.
Career stats — Statcast view
Flip the toggle and the table swaps to underliers (xBA / xSLG / xwOBA / Barrel% / HardHit% / EV / K% / BB% / Whiff% / Chase%). Cells are color-coded by MLB percentile — green = top quartile, red = bottom — so year-over-year movement reads at a glance.
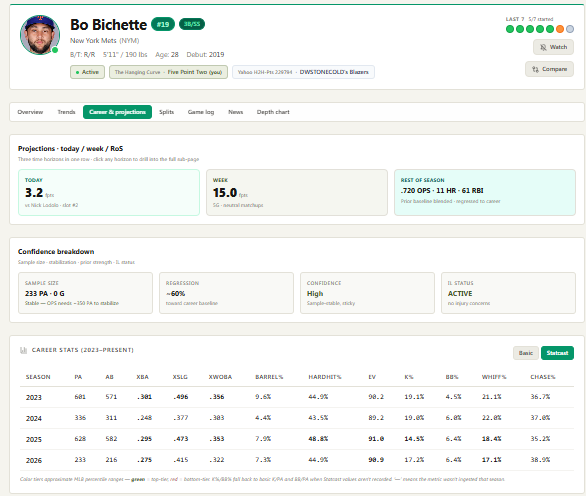
For Bichette across 2023–2026, the year-over-year story: Barrel% slid from 9.6 → 4.4 → 7.9 → 7.3. Hard Hit% climbed 44.0 → 43.5 → 48.8 → 44.9. K% drifted up 19.1 → 19.0 → 14.5 → 17.2. Reads as: contact quality has been stable-ish but never came back to his 2023 ceiling. The 2026 projection (.279 / 16 HR / .728 OPS) bets on a partial return.
Tab 4 — Splits
The start/sit reference tab.
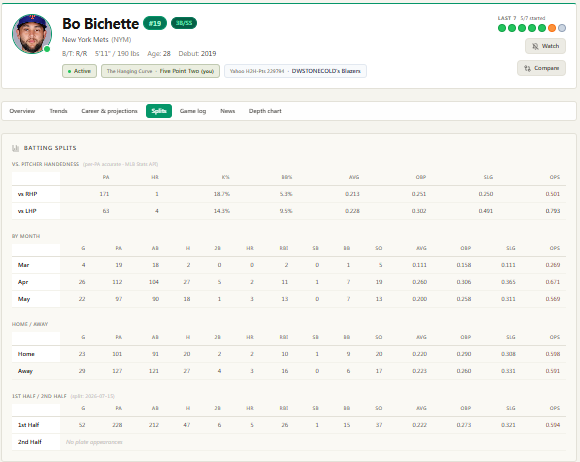
Four blocks, each a small horizontal table:
- vs Pitcher Handedness — vs RHP and vs LHP with the full slash + K% / BB%. Bichette is way better vs LHP (
.228 / .302 / .491 / .793) than vs RHP (.213 / .251 / .250 / .501). That's a real platoon — play him on lefty days. - By Month — Mar / Apr / May rows. Bichette: Mar
.111, Apr.260, May.220. The cold open + recovery + plateau arc. - Home / Away — even split —
.220 / .700 OPShome,.260 / .691away. No park lean. - 1st Half / 2nd Half — historical career splits at this point in the season.
The Splits tab is where you find the one number that flips your start/sit decision: a player with neutral overall stats can be a top-quartile play in the right split.
Tab 5 — Game Log
The verification layer. When the Trends tab says "trending up" and you don't believe it, you come here.
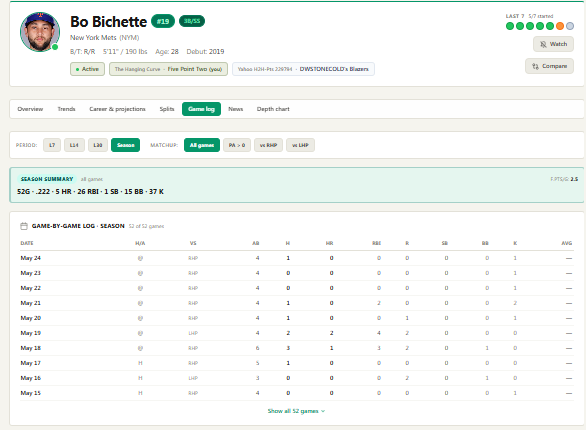
- Period filter —
L7 / L14 / L30 / Season. - Matchup filter —
All games / PA > 0 / vs RHP / vs LHP. - Season summary — top band with the totals for the filtered window (
52G · .222 · 5 HR · 26 RBI · 1 SB · 15 BB · 37 K · 2.5 FPTG). - Game-by-game — date, H/A, opponent, AB / H / HR / RBI / R / SB / BB / K / AVG.
Use this to confirm the patterns from the Trends tab. A 7-game OPS of .800 looks great until you scroll the log and find it's 2 monster games + 5 hitless ones — the kind of high-variance hot streak that doesn't sustain.
Tab 6 — News
Continuous feed of news items affecting this player. Beat-reporter tweets, status updates, injury news, lineup changes. Each item is tagged with type (injury, lineup, transaction, roster) and urgency (breaking, notable, routine). Tap any to read the source tweet inline.
This is the only tab where the answer is temporal — "what just changed in the last 24 hours that matters?"
Tab 7 — Depth Chart
Open this when the question is "is his playing time secure?"
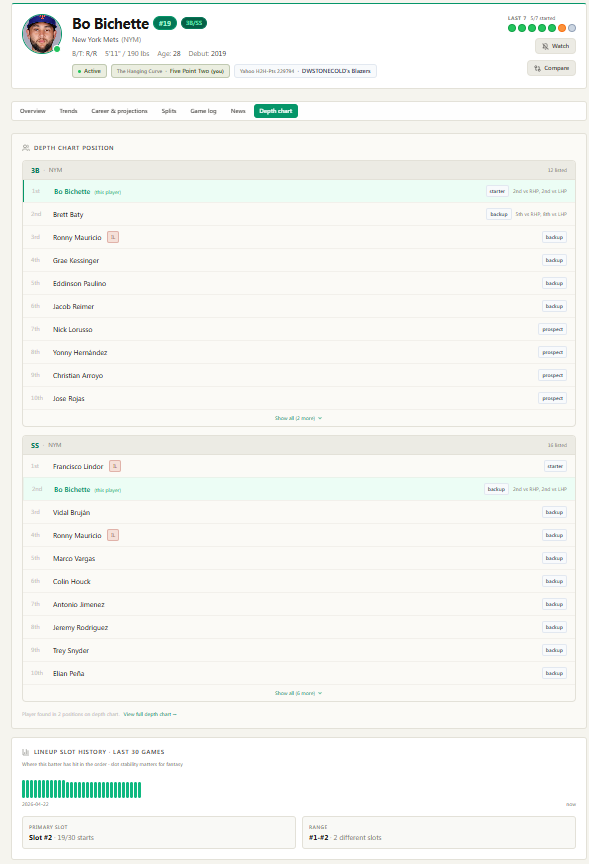
For Bichette, this tab reveals something the other tabs don't: he's listed at two positions — 3B (starter, NYM) and SS (backup behind Lindor, NYM). That's the dual-eligibility that makes him a roster-construction prize, surfaced explicitly with a "Player found in 2 positions on depth chart" callout. Each position shows the full depth (12 deep for 3B), labels each name (starter / backup / prospect), and lets you click into any of them.
Lineup Slot History · Last 30 Games
A green vertical bar chart at the bottom showing where the player batted in each of the last 30 games. Below it: two summary stats.
- PRIMARY SLOT — Slot #2, 19 of 30 starts.
- RANGE — #1–#2, 2 different slots used.
The takeaway in a sentence: "Bichette is locked into the top two slots of the order, with #2 being his anchor." That's playing-time security translated into a single number. A player whose range is #2–#8 across 6 slots is a player you can't trust to keep his lineup spot when he's slumping.
How to actually use this on your roster
The Player Profile tabs aren't equally weighted for every decision. Match the question to the tab.
| Decision | Open this first | Look for |
|---|---|---|
| Add today | Overview | Statcast strip + rolling-7 trends + start dot strip |
| Start tonight | Splits | Platoon, batting order slot history |
| Trade evaluation | Career & Projections | Statcast year-over-year + RoS line + confidence |
| Keeper league hold/cut | Career & Projections + Trends | Multi-year underlier trajectory + age curve |
| Buy-low window | Trends | xBA / xwOBA rising while AVG / OPS still down |
| Sell-high call | Trends + Game log | Raw OPS spiking while xwOBA flat |
| Lineup-spot fear | Depth chart | Slot history range + position-depth labels |
The decision-tree is the page. You don't have to read all seven tabs every time. You have to know which tab answers your specific question.
The Bichette read in one paragraph
Run it through the matrix:
- He's 93% rostered → no add edge. This is a hold/sell-high or hold/buy-low question, not a wire question.
- His rolling AVG and OPS are trending down. The naive read: drop or sell.
- His rolling xBA and xwOBA are trending UP. The smart read: the bad results are noise; the underlying contact quality is recovering.
- His BABIP is suppressed at .243 with the page explicitly tagging "positive regression upside on AVG."
- Career Statcast shows him stable on Hard Hit% and EV, just not back to his 2023 power-quality peak.
- His lineup slot is locked at #2 (19 of 30 starts) — playing time is secure.
- His platoon split is real (better vs LHP than vs RHP).
- No injury concerns, confidence is
High.
Verdict: buy-low candidate. The slump is real, the underlying quality is recovering, the playing-time floor is high, and the projection already prices in partial regression. If a leaguemate is shopping him after the .172 May stretch, the player profile page is your evidence trail.
Try it
Every player on the site has a profile at https://kodoanalytics.com/players. The seven-tab layout, the Statcast percentile strips, the rolling trends, the depth chart, the splits — all of it is one click from anywhere on the site (every player name links into it).
Seven tabs. Seven questions. One page that knows which one you're asking.